
The experts who feature in our top 200 list are at the forefront of the construction industry, setting trends, and inspiring others.
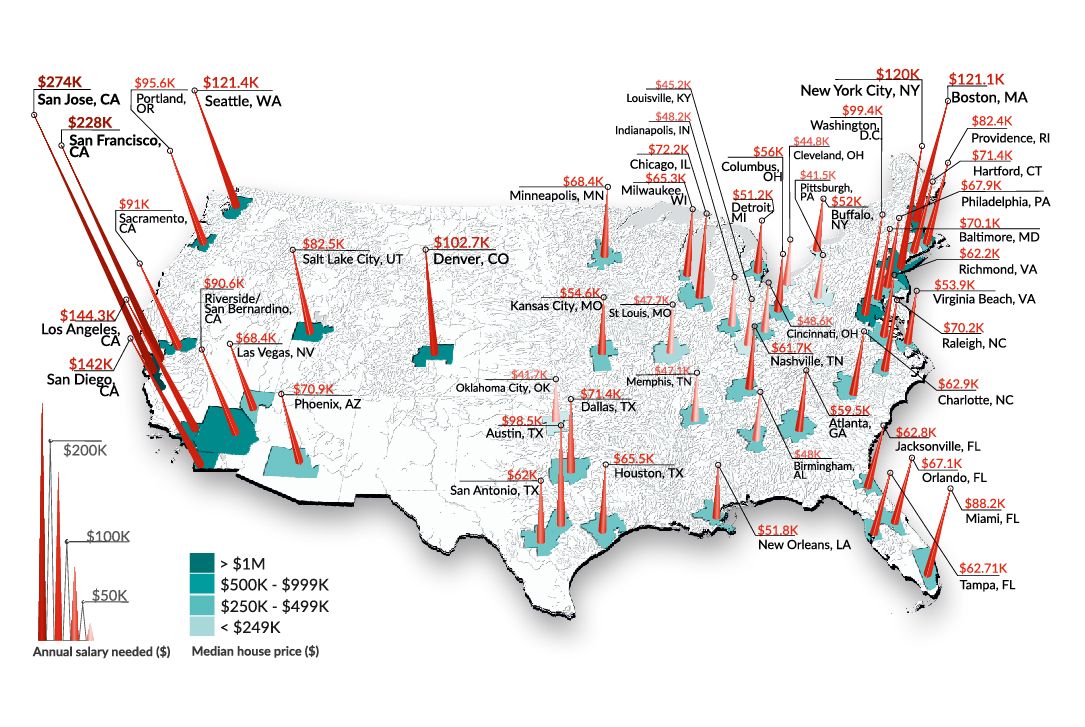
Our map combines median U.S. home prices with the annual salary needed in order to afford to own a home in the fifty largest metro areas.
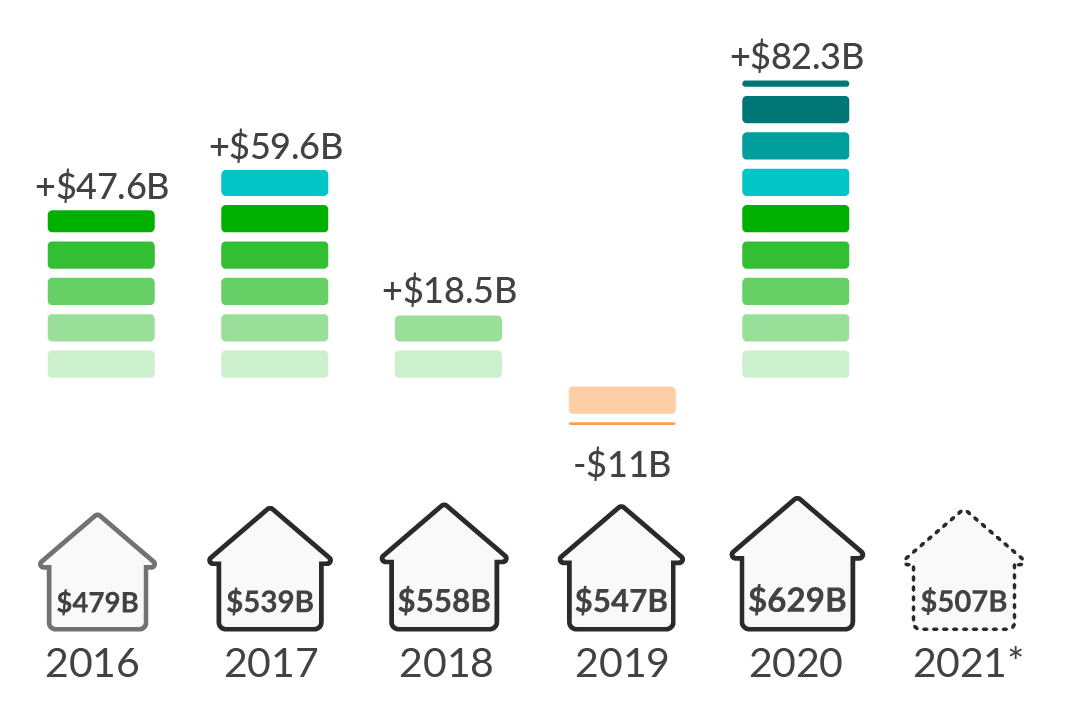
Residential construction spending saw its biggest year on year increase in over a decade in 2020, according to the US Census. In our latest publication, we explore the causes behind this rise, and what the industry can expect moving forward.
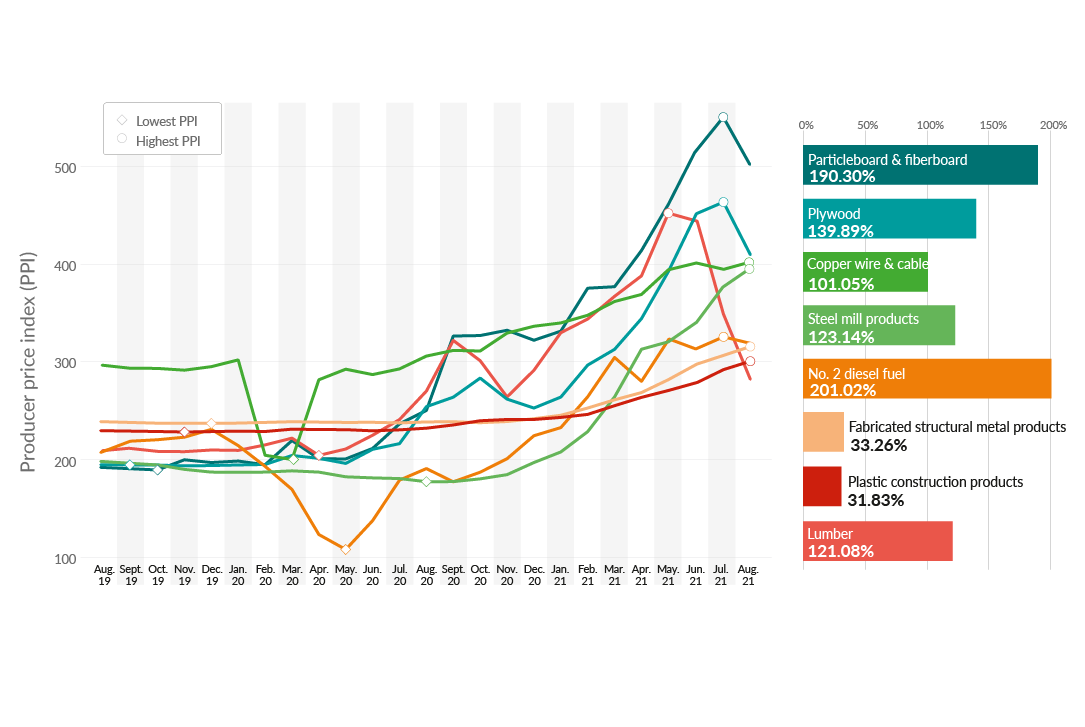
We surveyed 100 construction professionals from across the US to get insight into the current state of the industry, how companies are dealing with price hikes, and what the main effects are that companies are facing.
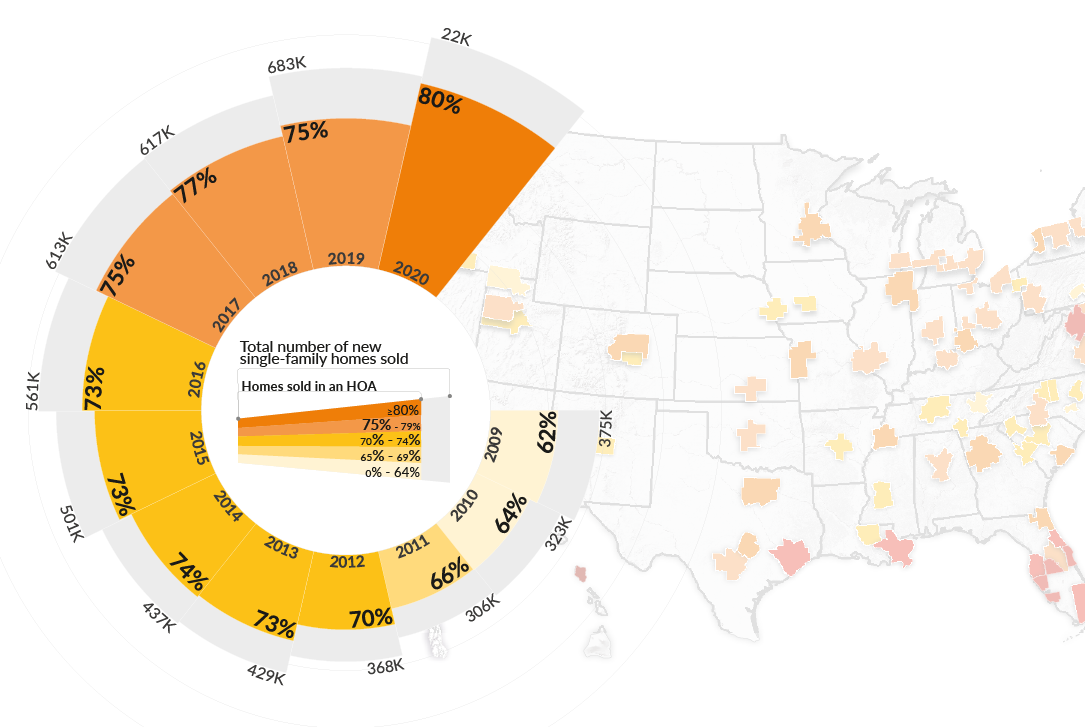
Using data from the US Census, we have visualized the increase of new single-family homes sold in a homeowners association and US metros with the highest monthly fees.

Estimated savings on bills from using solar energy can amount to a lot. We've taken a look at just what luxury home feature you could afford with 25 years of savings.
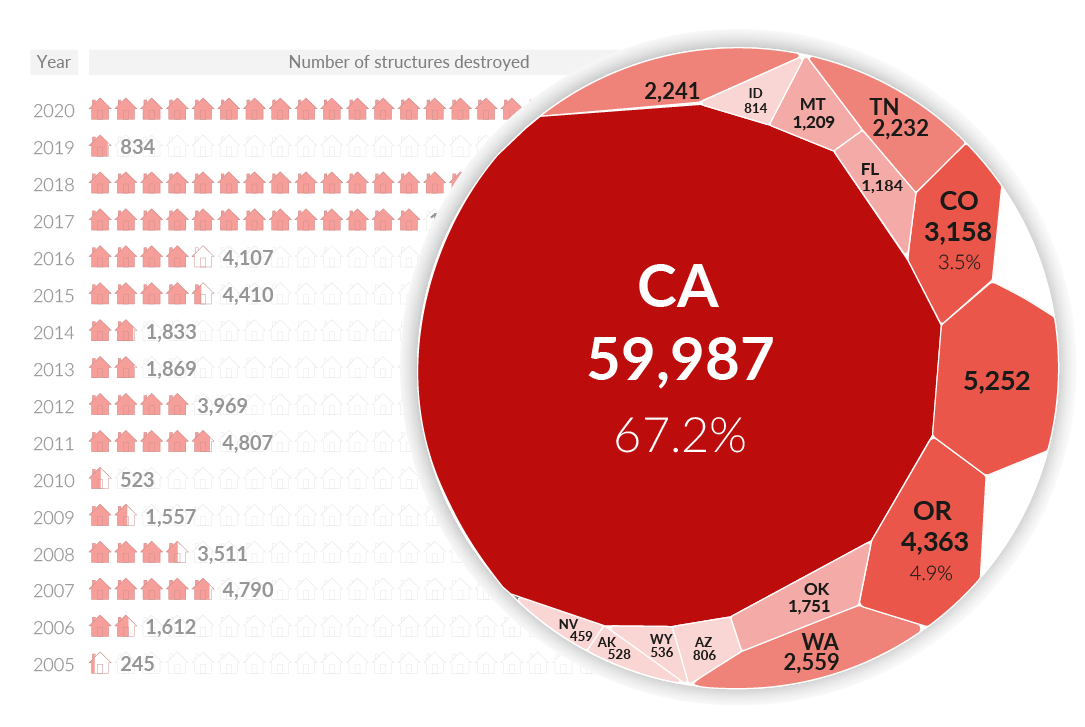
Analyzing data from the past 15 years, our graphics show how many structures have been destroyed by wildfire and in which states. We have also interviewed top experts to find out how homeowners can protect their homes from wildfire and what makes a home more fire-resistant.
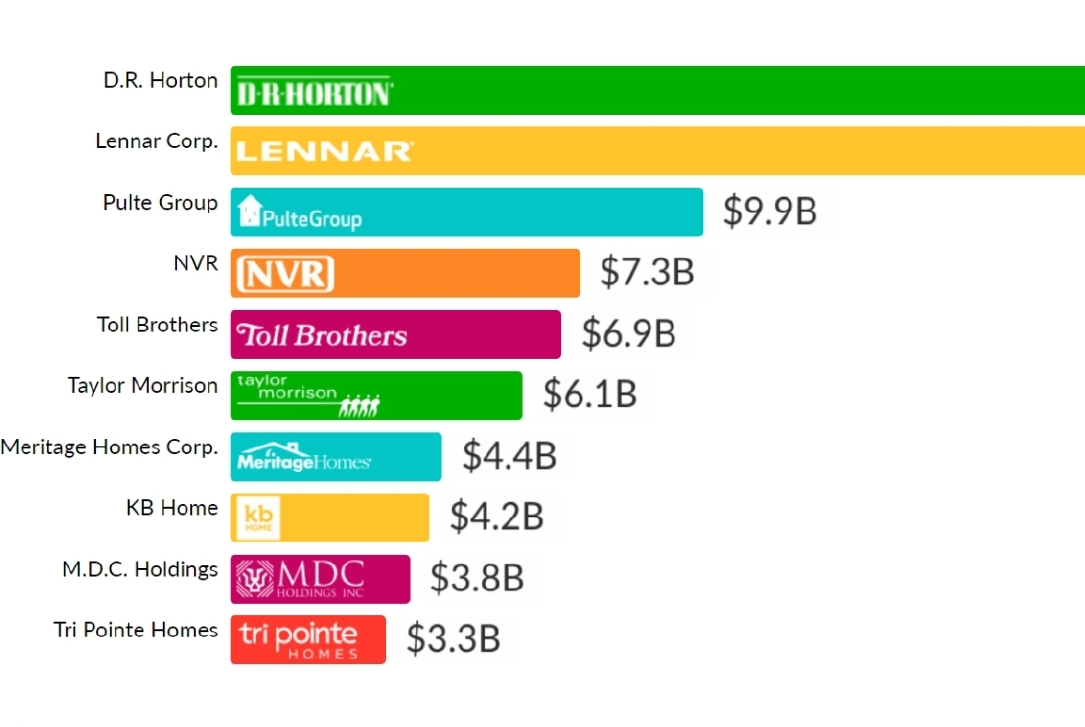
We explore the major players by gross revenue in the U.S. homebuilding industry with a GIF that compares who have been fighting for the top spots over the last 10 years.
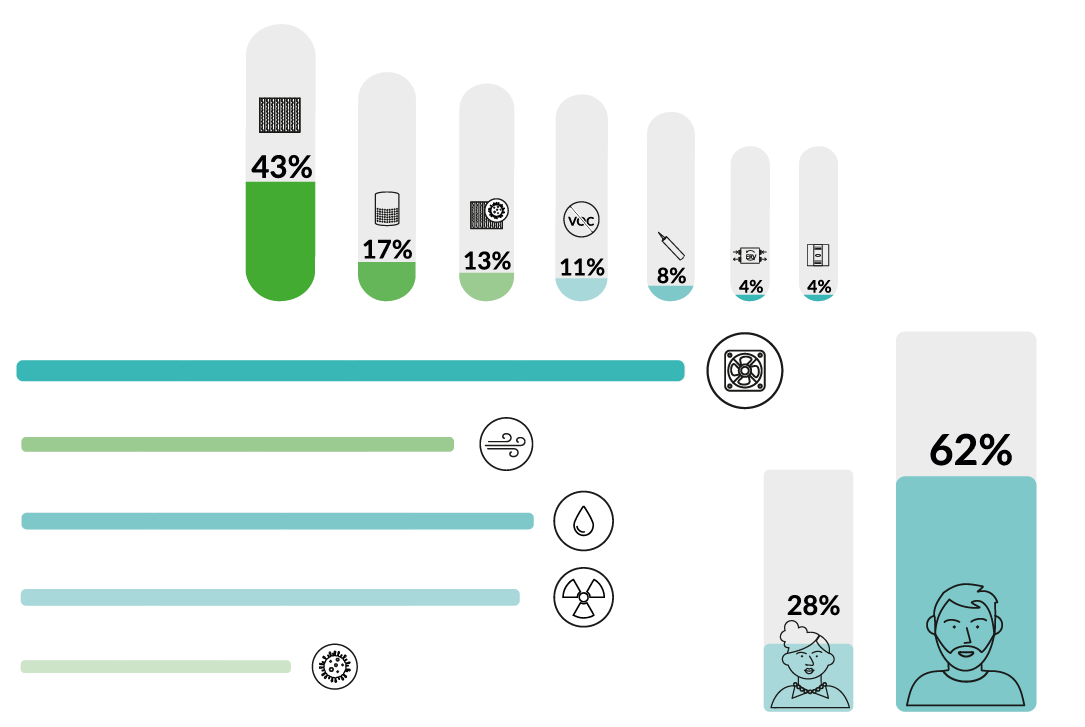
We surveyed and interviewed top industry experts to reveal healthy home solutions for homeowners. We explore how people can achieve a healthy home in 2021.
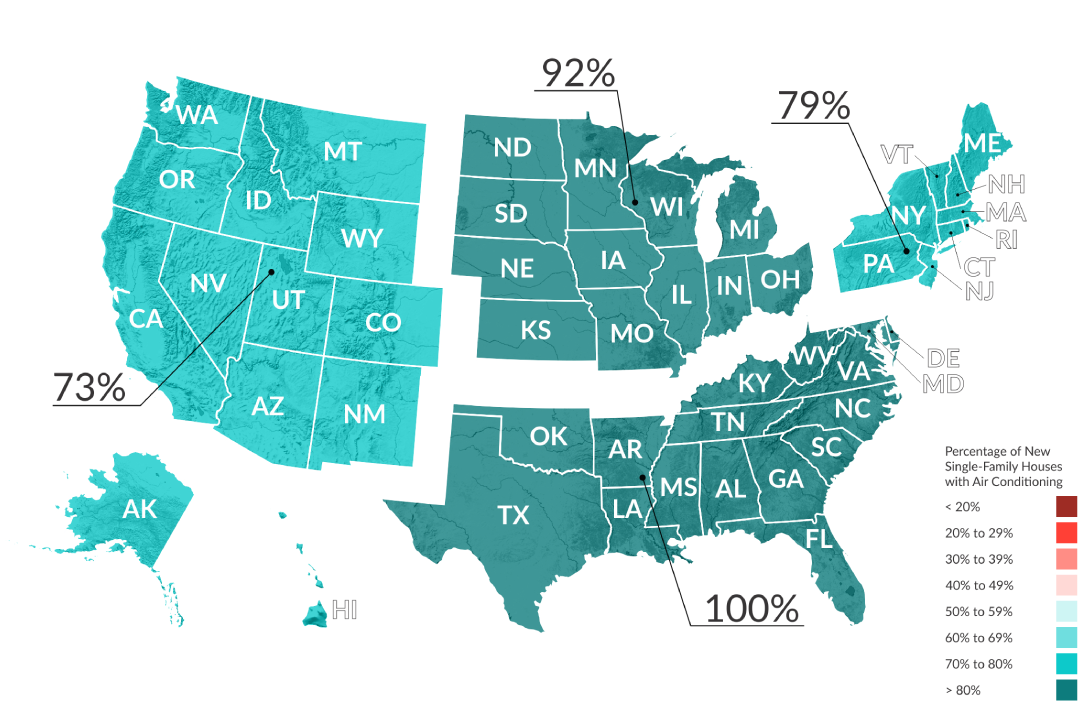
We have compiled data from the U.S. Census into a timeline to highlight the change in the amount of AC units installed in new single-family homes over the last 45 years.

We have surveyed and interviewed top industry experts to shed a light on build-to-rent homes in 2021 and what is driving the continuing growth of this sector.
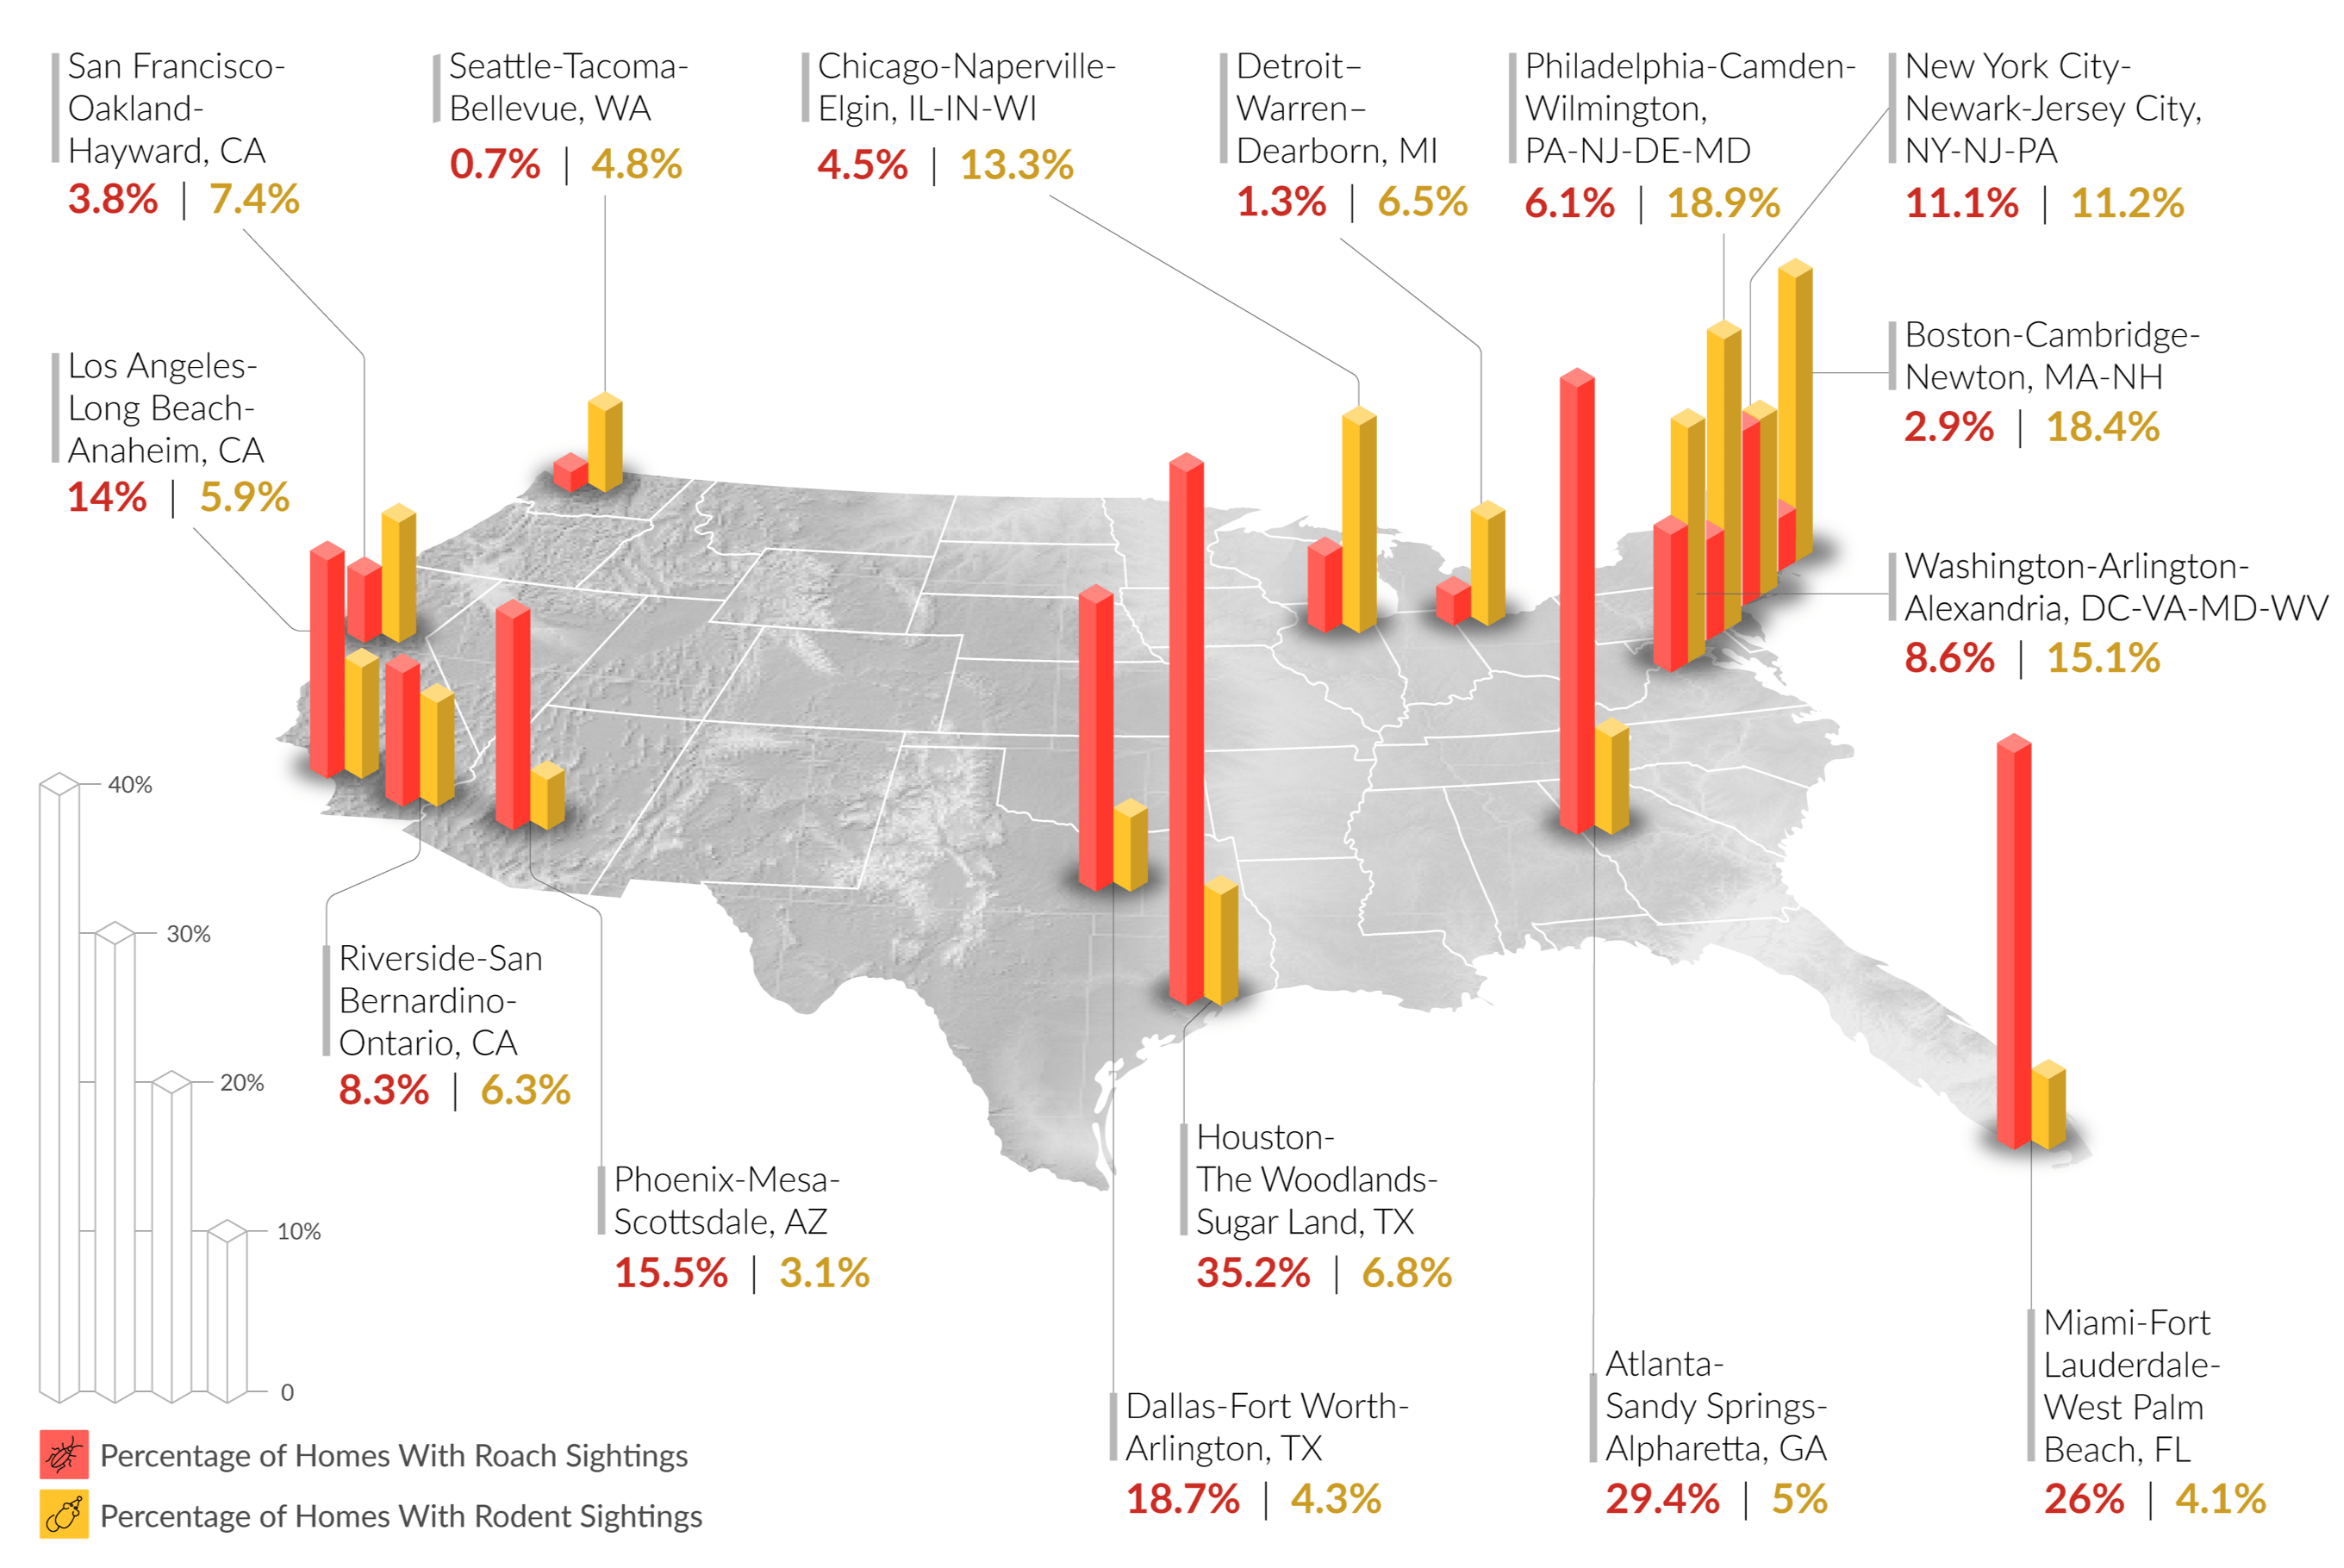
To spread the importance of World Pest Day, we gathered and analyzed the most recent U.S. Census Bureau’s American Housing Survey in a map that illustrates the percentage of in-home roach and rodent sightings across the top 15 most populous U.S. metropolitan areas.
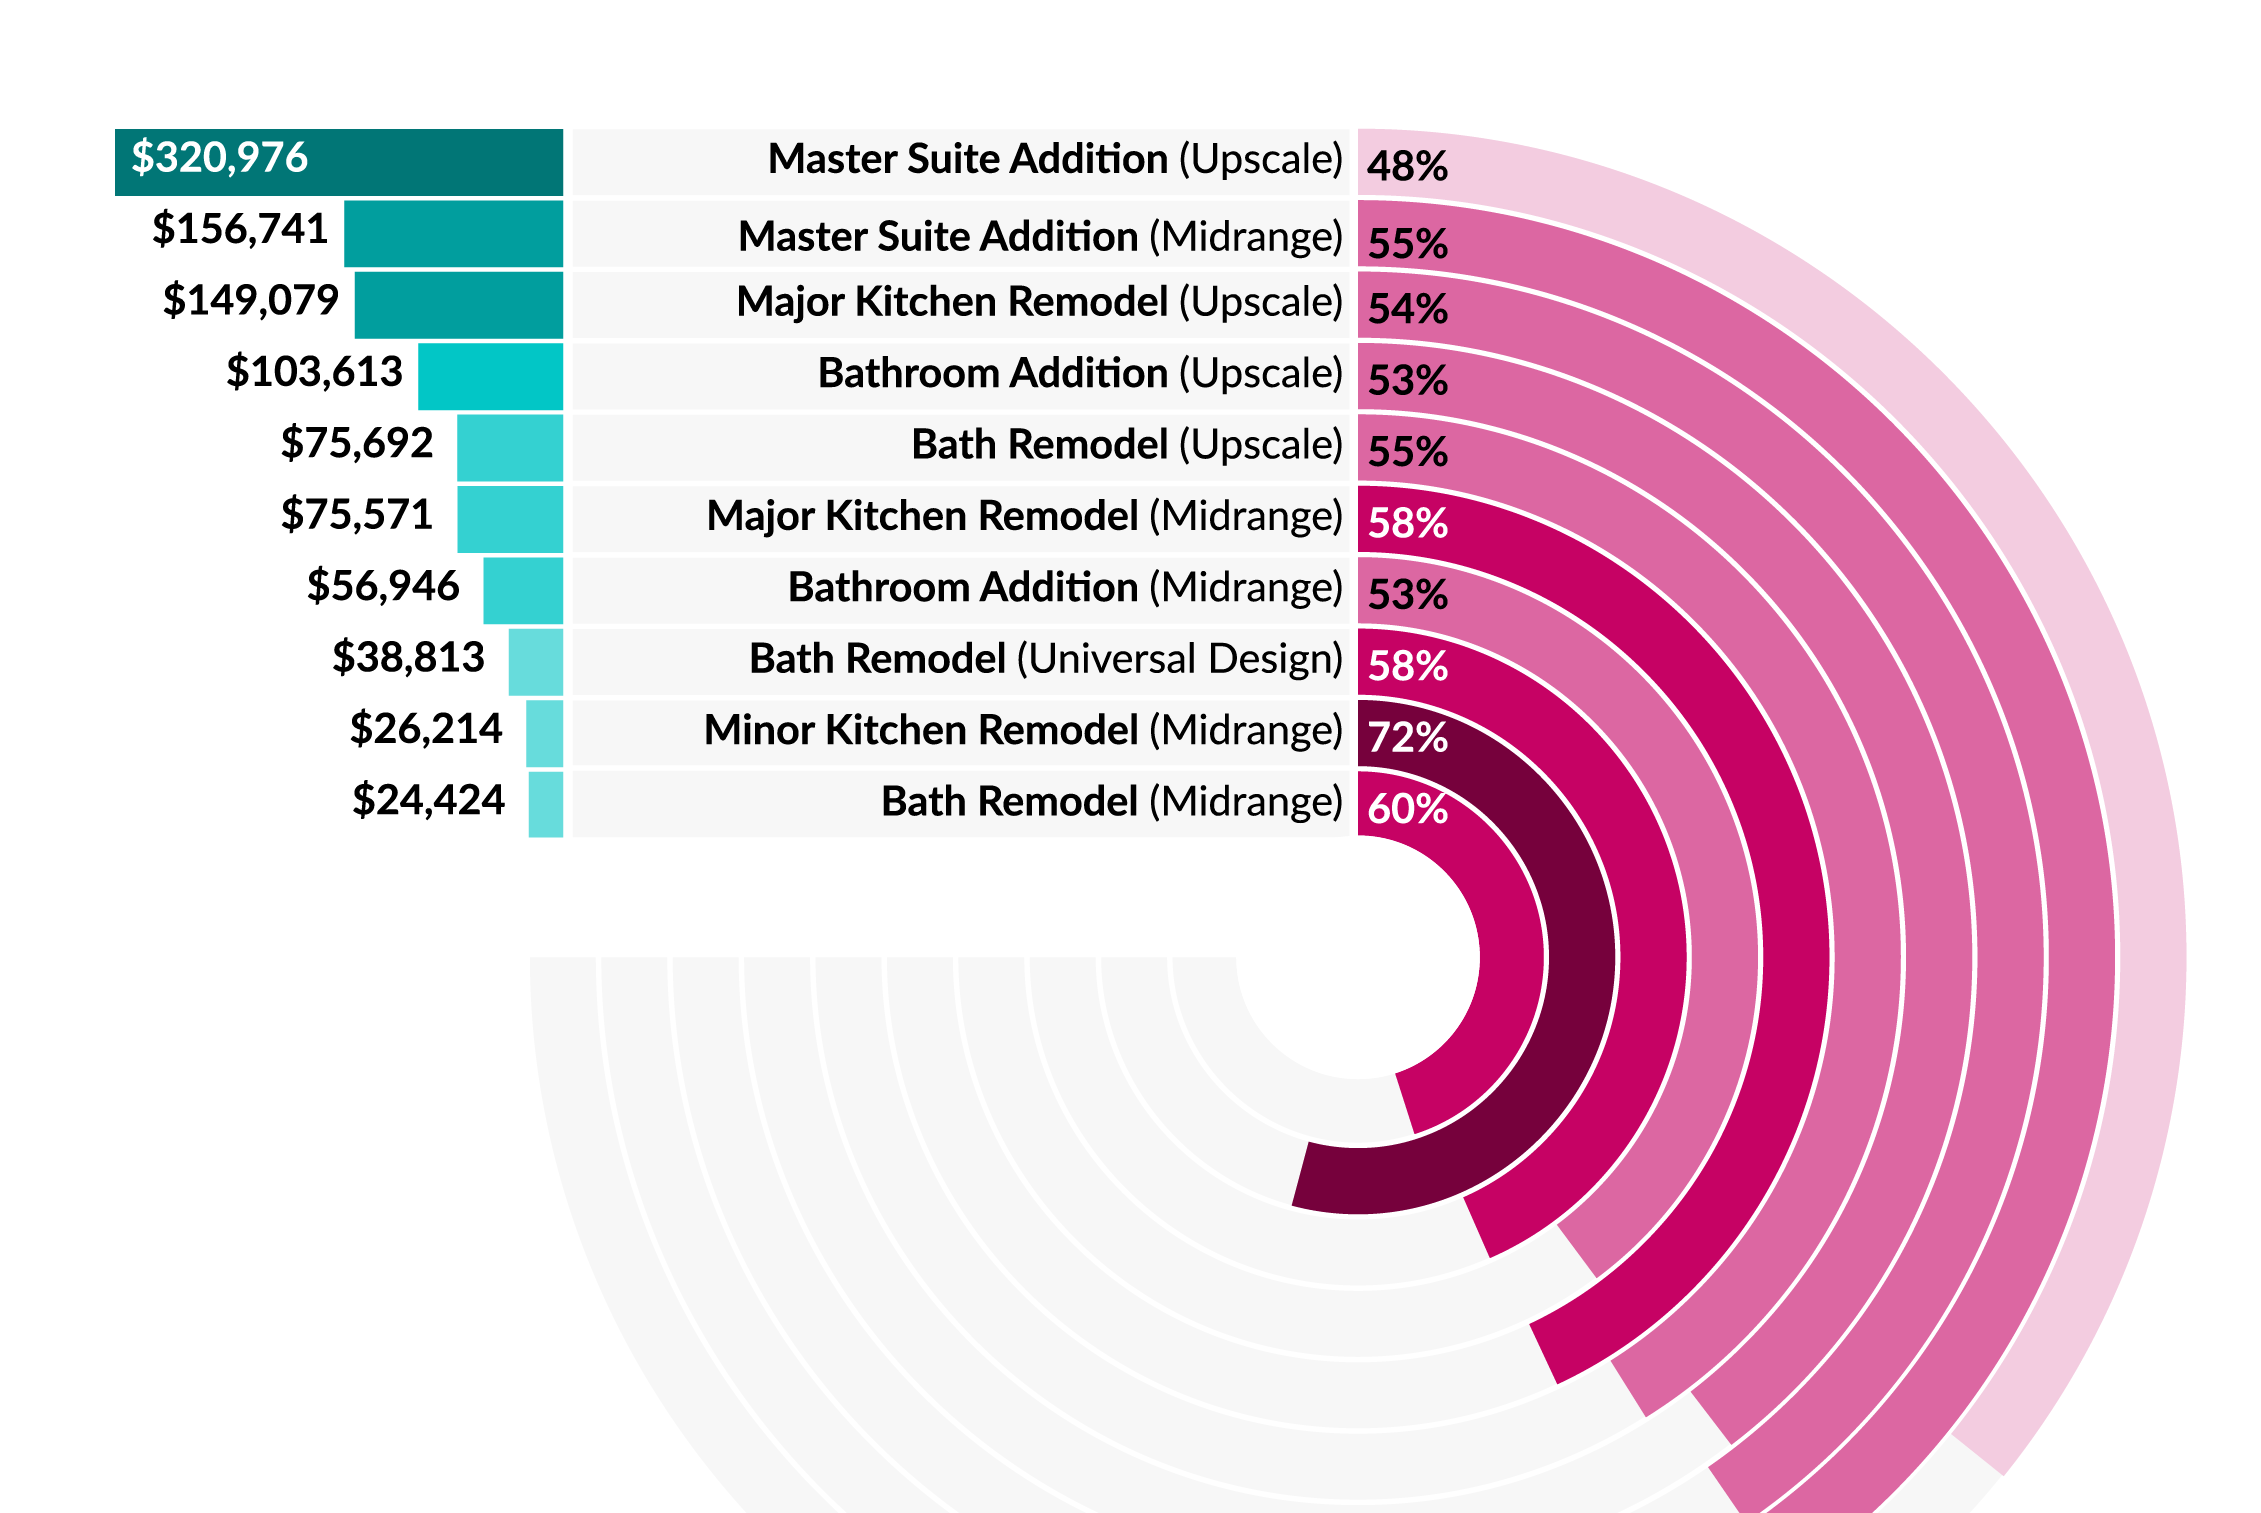
Homeowners can decide which projects to undertake by considering the best ROI home improvements. This is made easier with these visualizations of interior and exterior projects, with data from the Cost vs Value report.