According to an October 2021 Pew Research survey, nearly half (49%) of Americans say that availability of affordable housing in their local community is a major problem.
Since 2016, when the US reached home-price levels equal to those experienced during the peak in April 2007, there has been continuous increase in prices. Some growth, like the 17.5% experienced in the US between November 2020 and 2021, has been in the double digits.
Home price increases are not the only factor contributing to the affordability issue. Historically low mortgage rates continue to drive prices up and stagnating wage growth excludes a large portion of potential buyers as they become priced out of the market.
In this article we dive into what homeowners need to earn in order to afford a home in the largest 50 metro areas of the US.
Mapping House Prices and Necessary Salaries
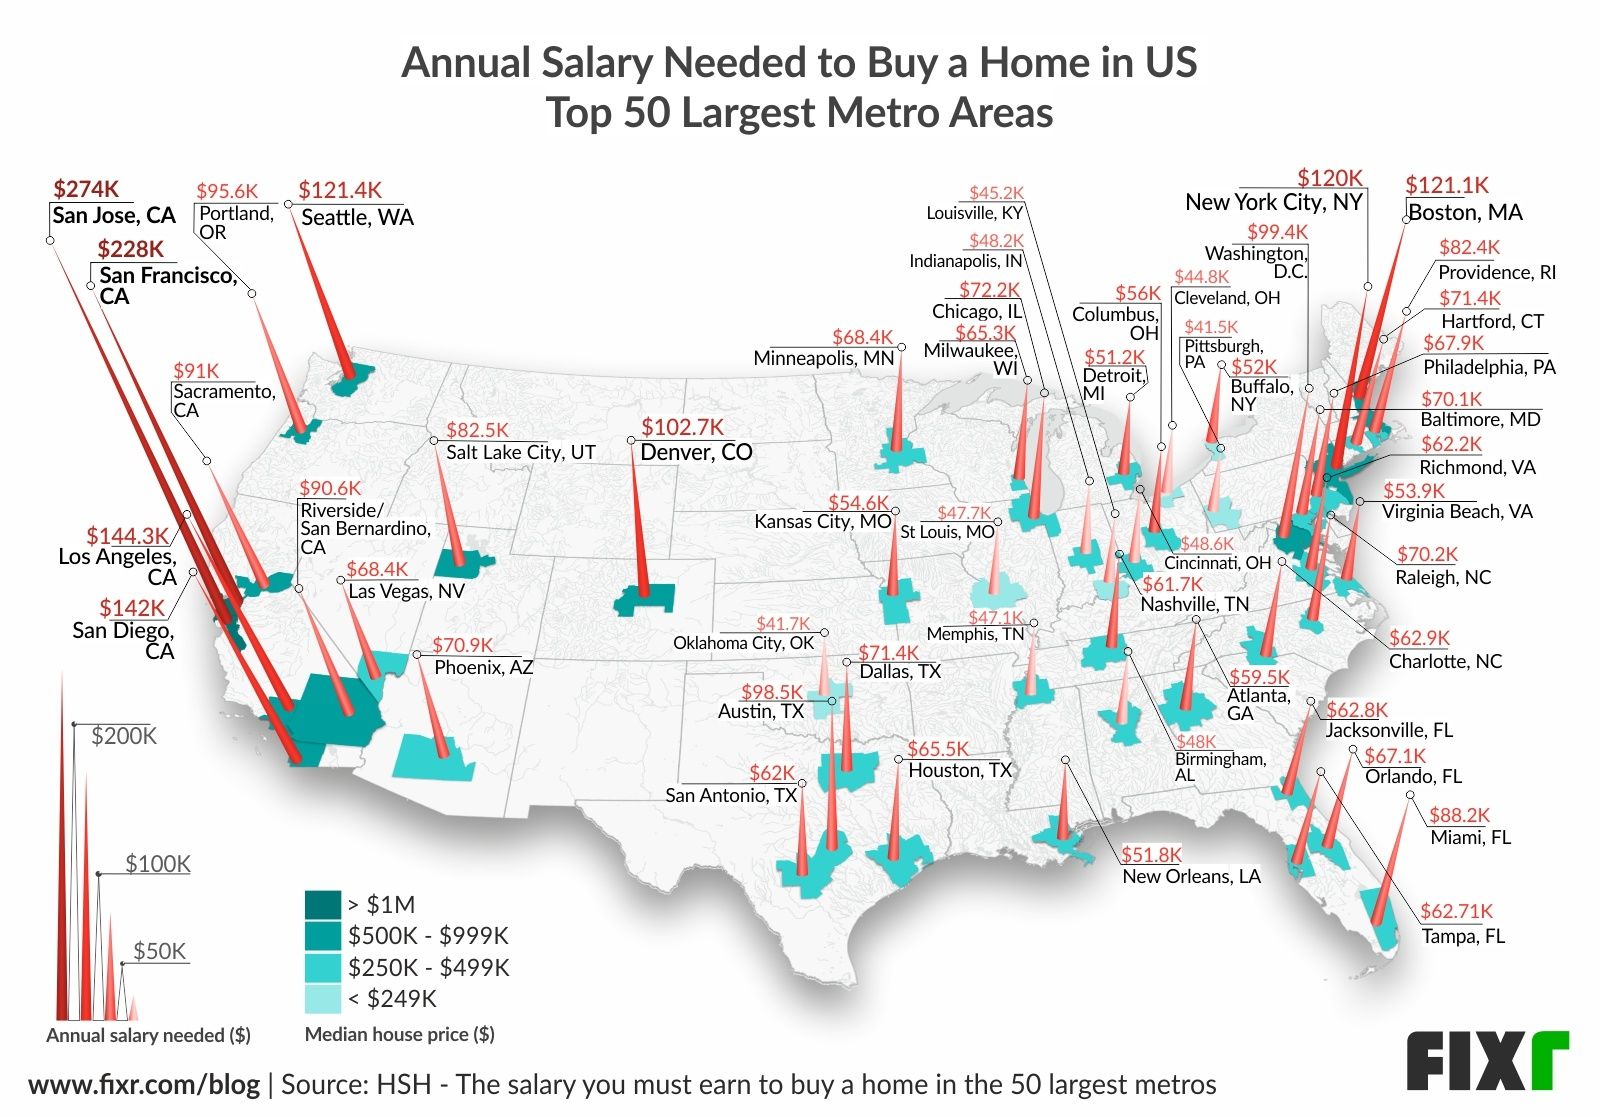
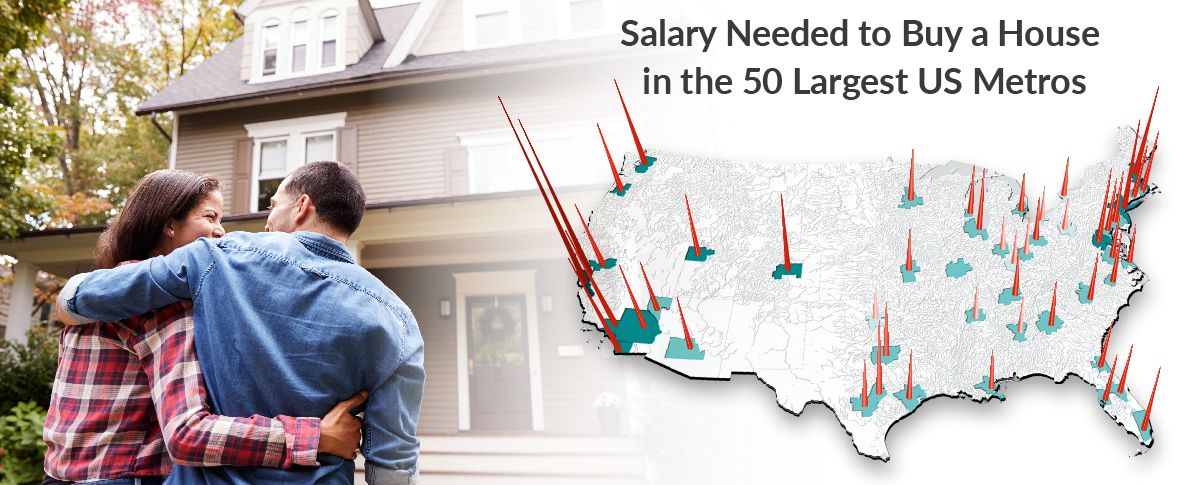
In the visualization presented above, the top 50 largest US metro areas (based on population) are displayed with their respective median home price in a blue scale; the darker the blue color, the higher the median price. The annual salary needed to afford the base cost of owning a home is illustrated by the red cones. The taller the cone and darker color red, the higher annual salary is needed.
As we can see, San Jose stands above the rest both in terms of median house price ($1,650,000) and required annual salary ($274K). The lowest salary needed is in Oklahoma City ($41.7K) where the median house price is also the most affordable ($198,500).
Data for the above visualization was gathered by HSH from several sources including: NAR’s 2021 third-quarter data for median home prices, Freddie Mac and the Mortgage Bankers Association of America national mortgage rate data for 30-year mortgages and available property tax, and homeowners insurance costs.
The blue-scale Median House Price is directly from the NAR report and the red-cone Annual Salary Needed is a calculation established to cover the mortgage's principal, interest, property tax and homeowner's insurance payment (PITI). The calculation uses the standard 28 percent "front-end" debt ratio, considers a 20% down payment, applies interest rates available for borrowers with good to excellent credit and incorporates local property tax and insurance costs. Because property taxes and insurance are dependent on the specific property, salary requirements are estimates and may need to shift up or down.
Which Are the Most Expensive Metros to Own a House?
The top 10 most expensive median home prices along with the salary required to afford them are detailed in the table below.
The top 6 metro areas where the most salary is required are located in the West region of the US. It is plausible then that 69% of Americans living in the West cite affordable housing availability as a major problem (compared with 49% nationally).
The top four cities of San Jose, San Francisco, Los Angeles, and San Diego are all located in California and median home prices all meet or exceed $850K. To afford homes in these metro areas, one needs to make upwards of $142K.
Seattle, Boston, New York City, Denver, Washington D.C, and Austin round out the top 10. The median home prices between $498.4K and $708.4K and the required salaries stretch from just shy of $100K ($98.5K) to just above $120K ($121.4K).
Take note that a metro area with a higher median home price does not always equate to a higher salary requirement. For instance, a median home in Denver is $28K more than one in New York City, yet the annual salary required in New York City is approximately $17K more than that of Denver. This is due to the differences in local taxes and insurance costs.
Which Are the Cheapest Metros to Own a House?
The bottom ten of the top 50 metro areas where salary is needed in order to own a home are shown in the table below. These salaries range from $41.5K up to $51.2K. Median house prices range from just shy of $200K ($198.5K) to $273.6K. This is a range of under $80K compared to the top ten which has a range of over $1M.
Half of the bottom ten metro areas are in the Midwest indicating that it is a more affordable region than others. This is supported by the fact that only 33% living who live here cite affordable housing as a major problem. Four metros are in the South where 44% of residents cite the issue and only one is in the Northeast where the issue is cited by 49% of those living there. The data agrees, as median prices fall in a region, fewer people cite affordability as a major problem.
Millennials: Can the Main Home Buyers Afford a Home?
Since 2014, millennials have been the largest share of buyers, holding about 37% of the market share for homebuyers. But even with over a third of the market share compared to other generations, a study done in 2021 indicates that only 43% percent of millennials were homeowners. This is the lowest home ownership rate of any generation and well below the overall average of 65%.
Wage stagnation, underemployment and unemployment have plagued many millennials and recent data indicates the average salary for a millennial is at just $47,034 per year. Student loans, which are most prevalent among the millennial generation, levy an average debt of $38,877 and affect 14.8M people. Taking these factors together, it is easy to surmise that low pay and high debt can directly impact this generation’s ability to afford to purchase a home. Many are not even able to amass the typical 20% down payment needed to enter the home buying market.
What Does This All Mean?
Experts have weighed in on where they believe the market is headed. Fannie Mae has forecasted that while housing rates will continue to climb, the rate at which they do so will not be as steep. They also expect mortgage rates to climb this year. Oftentimes, rising mortgage rates can put downward pressure on home prices as buyers cannot borrow as much. Unfortunately, the predicted rise in rates (from 3.1% to 3.4%) may not be enough to actually pull prices down.
According to the Associated Press, wages are rising much faster now than they were during the recovery from the Great Recession of 2008-2009. Inflation is taking a bite out of this; however many economists expect inflation to slow somewhat.
While the top 50 list outlined above contains only two US Metro areas (Cleveland and Louisville) that millennials making an average salary may be able to afford, the most recent forecasts and findings may provide certain optimism for those, millennial or otherwise, looking to enter the home buying market.


