The demand for solar energy in the U.S. has increased by 784% over the past 10 years. In 2008, 1.2 gigawatts (GW) were installed; 2017 installations accounted for 10.61 GW ultimately resulting a total of 53 GW of solar energy installation, generating enough energy to power 10.1 million homes.
The U.S. currently ranks fourth in the world in terms of solar power production; however, they are home to the world’s largest solar power plant, the Ivanpah Solar Power Facility, located in the Mojave Desert in California. This plant can power more than 140,000 homes in California during peak hours and reduces carbon dioxide (CO2) emissions by more than 400,000 tons per year.
As climate change persists and going green continues to trend, it is no wonder that both the importance and popularity of solar energy is growing. Solar’s offerings include being sustainable, inexhaustible, and non-polluting with the added advantage of consumers being able to benefit from either partial or complete consumption of power from solar sources, ultimately affording more flexibility and cost saving options to consumers.
Solar Savings Across the States

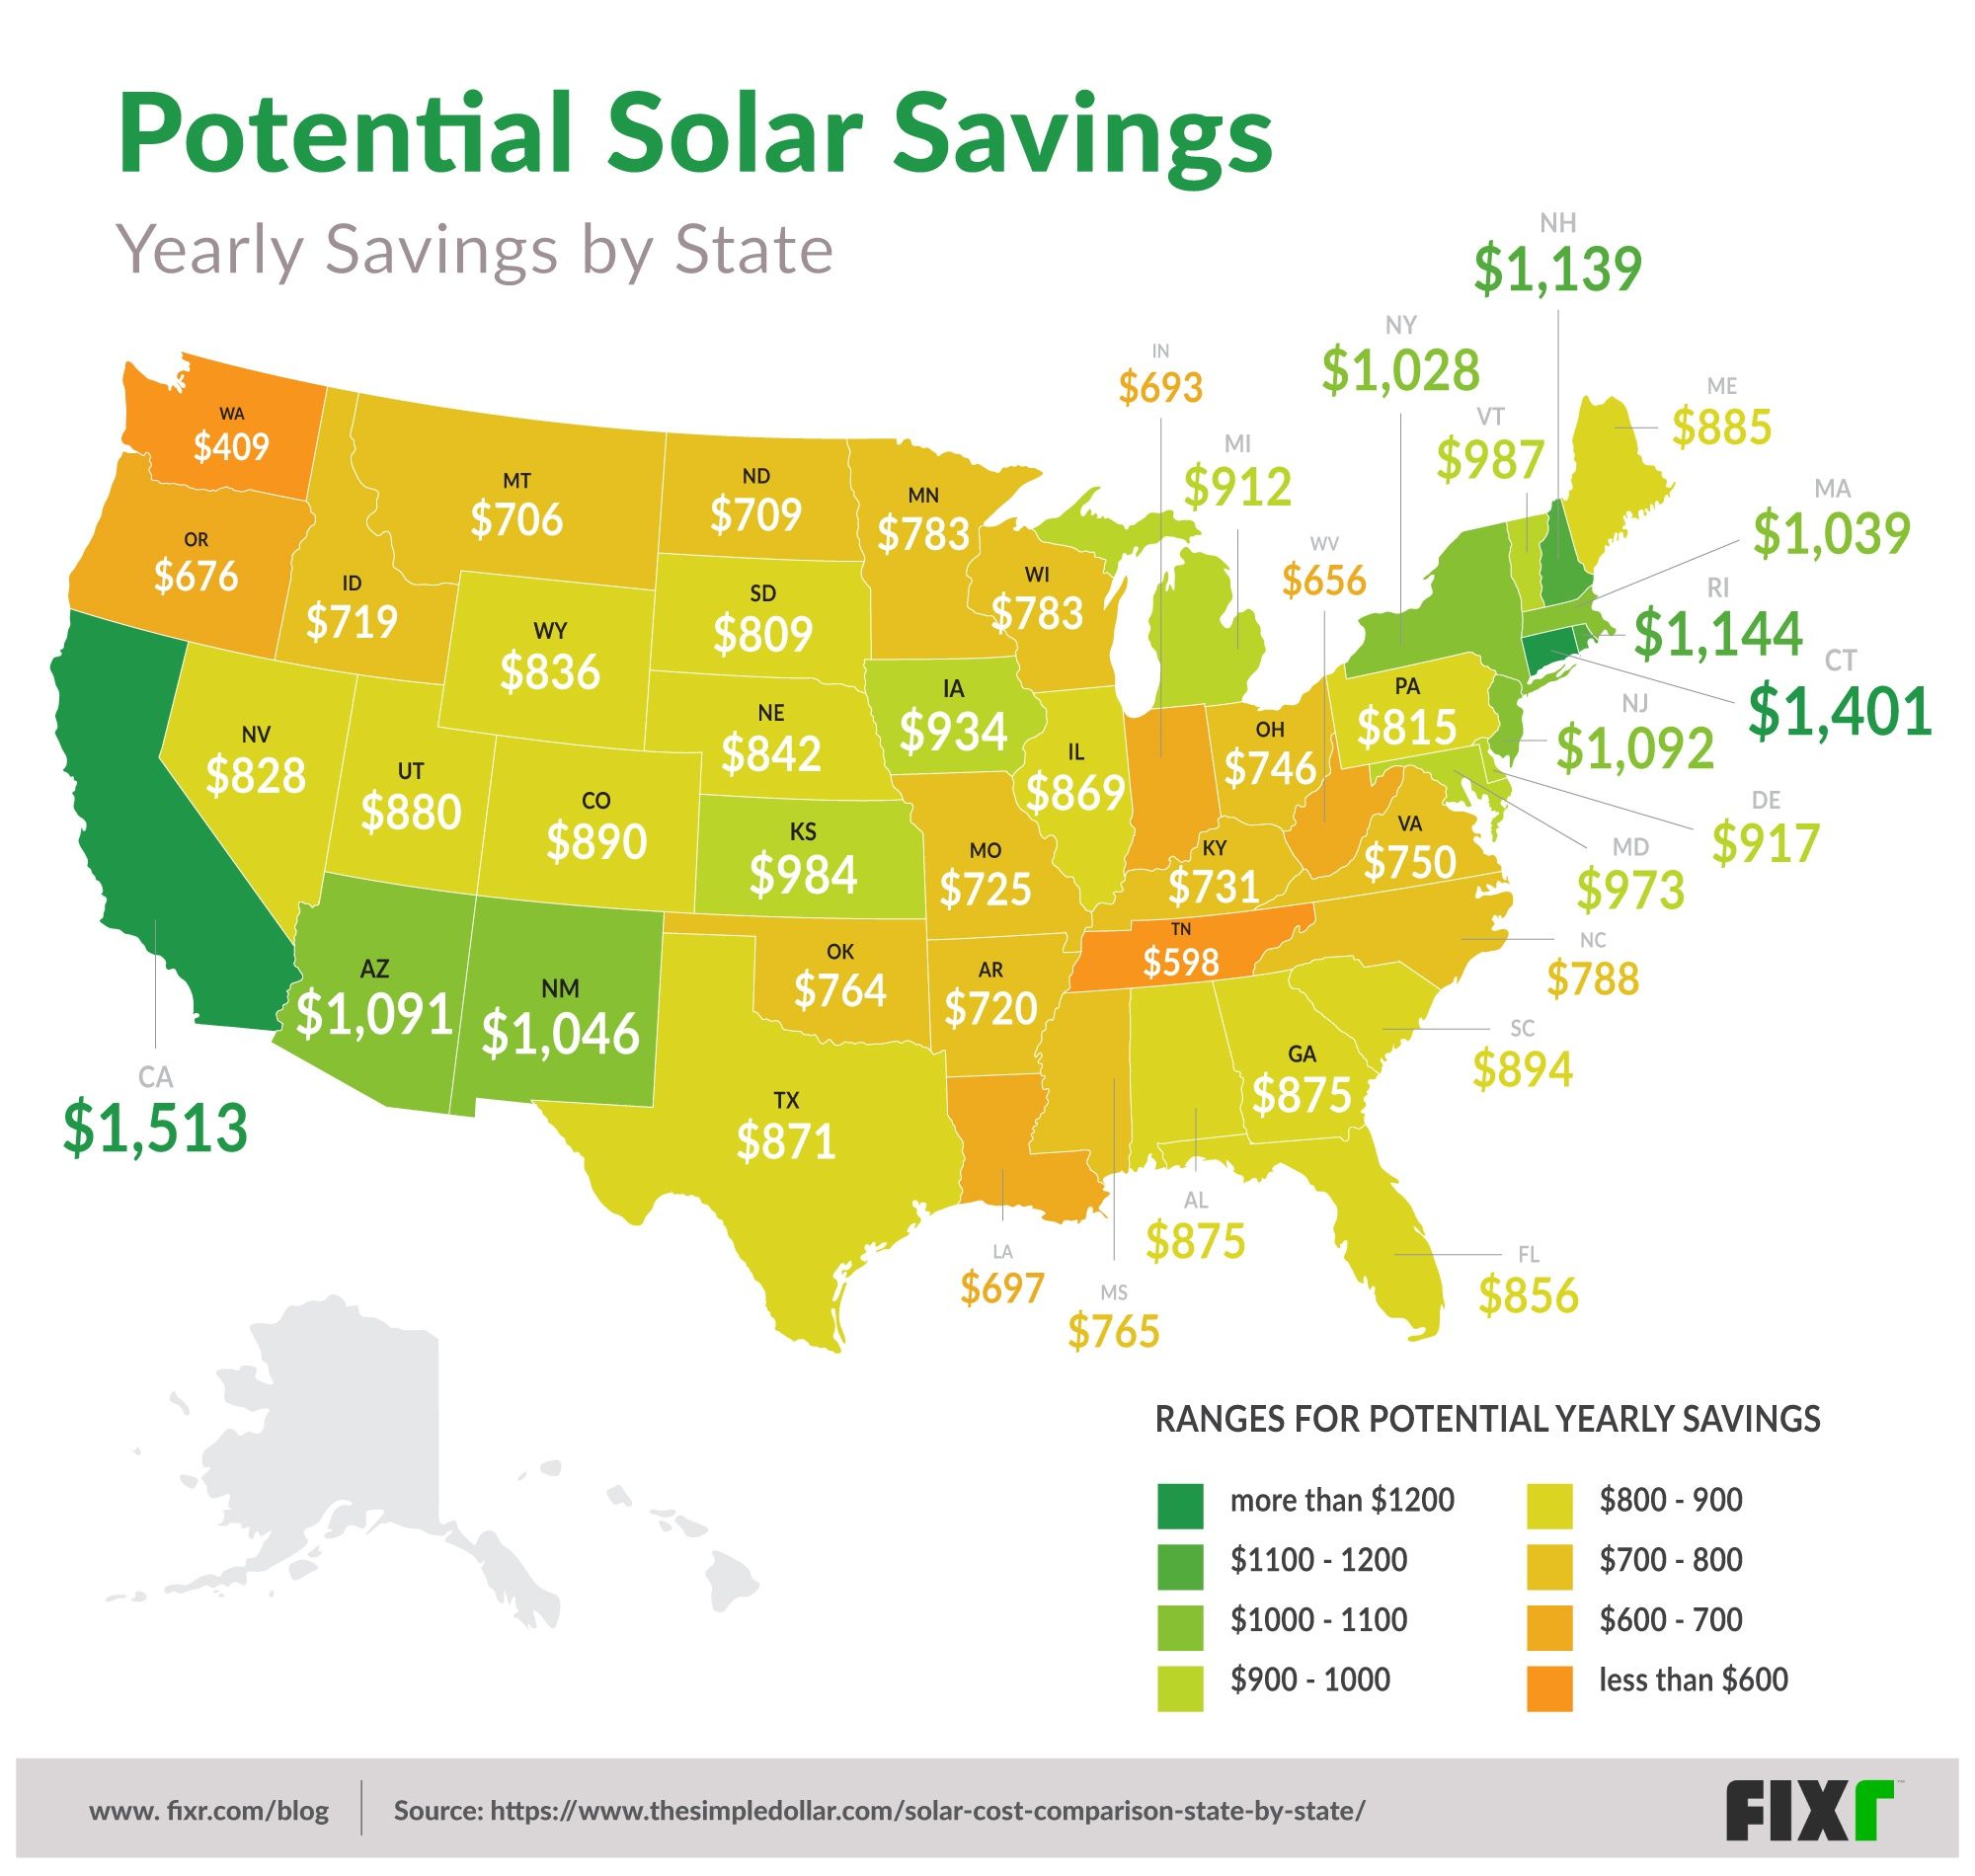
The above infographic, with data compiled by The Simple Dollar, displays the 48 continental states in terms of potential yearly savings (per household) through installation of solar panels.
Interestingly, the top two states which have the potential for the most savings are on opposite coasts. California, with a potential savings of $1,513 per year lies on the southwest coast while Connecticut, with a potential savings of $1,401 per year, is situated on the northeast coast.
There are nine states in total that have potential annual savings exceeding $1,000, accounting for 25.2% of the total potential savings of all the states in the list. The map clearly shows that these states are consolidated in the southwest and northeast regions of the country, with only two states (Arizona and New Mexico) being “non-coastal” in nature.
Overall, the difference between the state with the highest potential savings (California at $1,513/yr) and the state with the lowest (Washington at $409/year) comes to $1,104 per year (or $92 per month). The percentage that each state saves in comparison with the total saved ranges between 0.98% and 3.63%. This data indicates that while there is a difference in potential savings, it is not relegated to only one geographic area of the country nor is it such a huge difference that it would dictate future solar power investments.
To Buy, Lease, or Forgo?
The national average for solar panel installation is between $20,000 and $25,000. These costs can be reduced significantly by applying federal and state tax credits. Energy Sage estimates the average cost of a 5kW system would be $10,990 after considering these tax credits. The average number of years to break even on a new system installation can be calculated by dividing the average cost ($10,990) by the potential yearly savings per state. These calculations result in pay off ranges estimated from 7.3 years (California) to 26.9 years (Washington). This is imperative to consider when weighing the decision to invest in solar power, because depending on where you are in the country will determine how long it takes for your investment to pay off.
As mentioned, the above figures consider tax credits; however, they do not incorporate other cost reduction measures such as cash rebates, solar renewable energy certificates (SRECs), and Performance-based incentives (PBIs). These options vary between states and even municipalities across the country and are available through a variety of associations not always governmental in nature. Before investing in solar power, one should investigate the current offerings in their area to determine a best-estimate in cost and break-even point.
For consumers living in states with a longer payback period and/or low levels of cost reduction measures, there is another incentive that may make solar a worthwhile investment. Berkeley Lab conducted a study that found an increase in home value of up to $15,000 for a home with a typical system installed.
Even with incentives, not all consumers desire to make the initial investment in solar, but still wish to partake in the eco-friendly practice and reduce their carbon footprint. Leasing is an option that offers consumers a “zero money down” opportunity while still providing monthly savings. Leasing, like buying, is not for everyone and consumers should carefully consider before signing on. Lessees are disqualified from taking advantage of tax credits and some other local incentives and long term savings are often more modest than those achieved through outright purchases, either with cash and loans.
Despite the rising popularity, reduced costs, and easier access to solar, many consumers will decide to forgo purchasing or leasing a system this year. For those that forgo, the future may soon offer new solutions by means of consumer direct sales of energy produced at solar farms and peer-to-peer energy sales. Startups like Squeaky and LO3 Energy are only the beginning of what might be considered a completely new market for buying and selling electricity that no longer includes the traditional power companies. There are still regulatory, economic, and political barriers to community shared solar becoming mainstream; however, with continued pressure for and interest in pursuing renewable sources of energy, there is great potential for shared solar to become as common as today’s sale and leasing options are.


